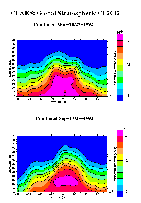
MLS ClO,O3,HNO3, col. O3 1 Mar 1996
UARS MLS Measurements for March 1, 1996
|
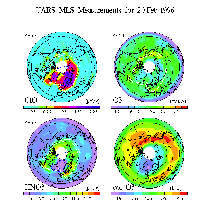
MLS ClO,O3,HNO3, col. O3 20 Feb 1996
UARS MLS Measurements for February 20, 1996
|
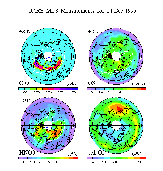
MLS ClO,O3,HNO3, col. O3 21 Dec 1995
UARS MLS Measurements for December 21, 1995
|
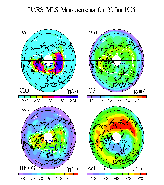
MLS ClO,O3,HNO3, col. O3 30 Jan 1996
UARS MLS Measurements for January 30, 1996
|
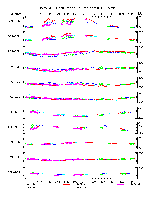
MLS column O3 timeseries apr 96
UARS MLS Mean Ozone Column above 100hPa for April 1996
|
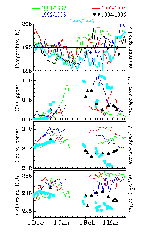
vortavg_T_clo_o3_92-96
465 K minimum Arctic vortex UKMO temperatures, 465 K vortex-averaged MLS ClO, 465 K vortex-averaged MLS ozone, and column ozone above 100 hPa from
MLS, averaged in the region north of 40 deg and with column ozone less than 260 DU.
|