|

|
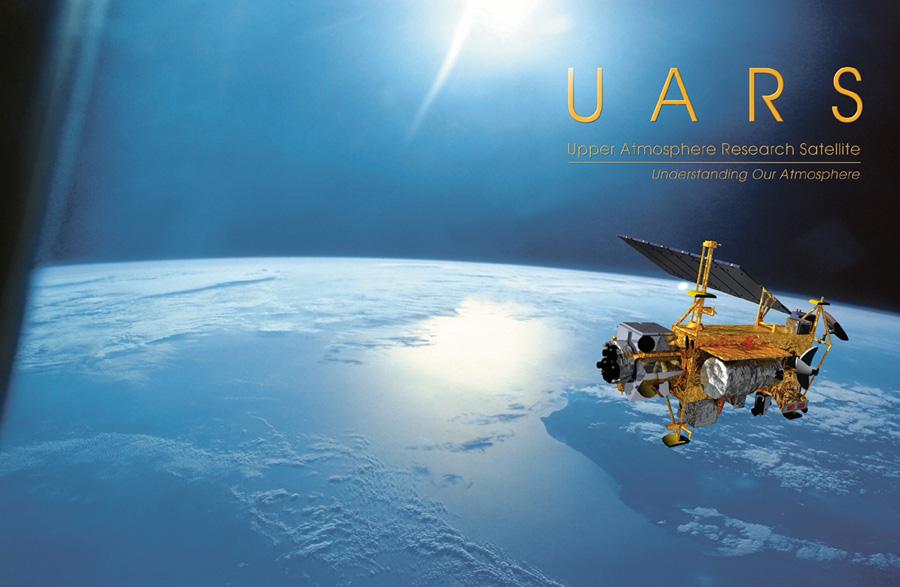
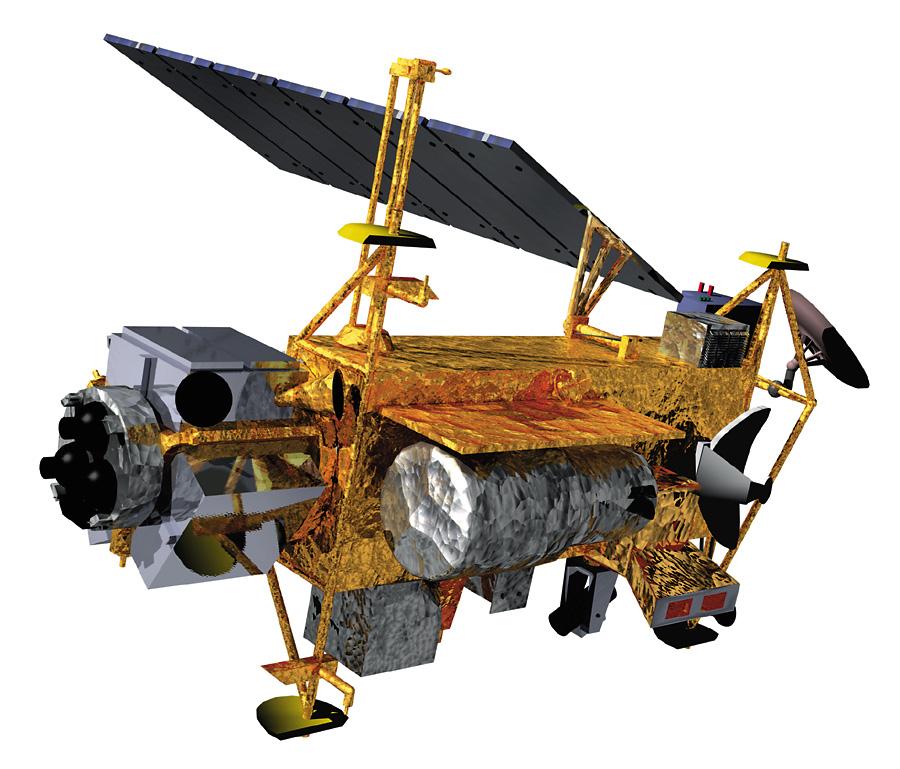
The cover
of the brochure contains an image
of UARS above the Earth's surface.
[TOP]
|
|
|
Temperature
and Transport
[TOP]
|
|
|
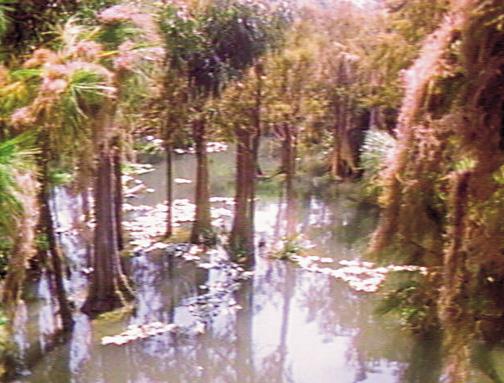
Natural and Man-made Pollutants:
Methane (swamp),
Sulfur (volcano),
Nitrous Oxide (tractor),
Halocarbons (air
conditioning unit)
[TOP]
|
|
|
The Ozone
Layer
[TOP]
|
|
|
SRRP
[TOP]
|
|
|
The Antarctic
Ozone Hole
[TOP]
|
|
|
Confirming
the Problem with CFC's
[TOP]
|
|
|
Development
of the Antarctic Ozone Hole
[TOP]
|
|
|
Ozone Hole
Mapping Continues with UARS Instruments
[TOP]
|
|
|
CLO Variations
Over the Arctic
[TOP]
|
|
|
Catalytic Cycle of Polar Ozone Destruction:
Chlorine reacts with ozone, forming chlorine monoxide (1-3),
starting the catalytic ozone-destruction cycle. Chlorine monoxide
can react with itself to form CI2O2 (4-5), which is broken apart by sunlight
(6), producing chlorine atoms and an oxygen molecule (6-7). The
cycle begins again as a chlorine atom reacts with more ozone
(1).
[TOP]
|
|
|
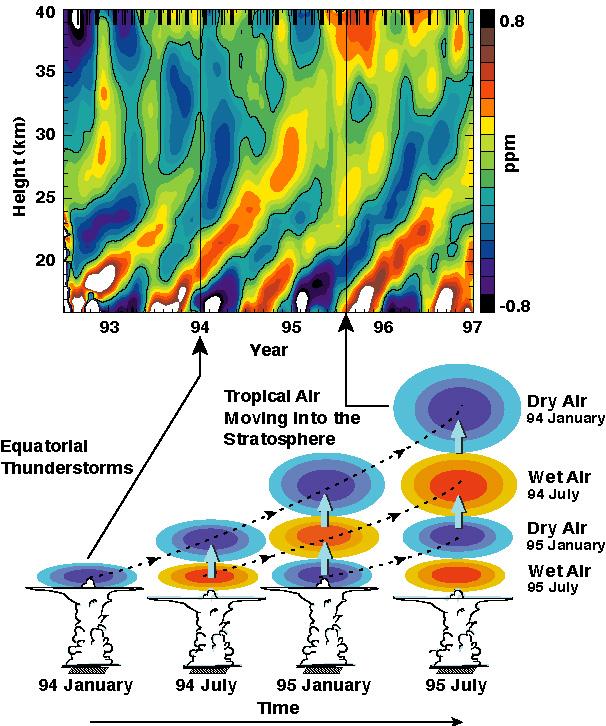
Ascent of Tropical Water Vapor:
(TOP) Deviations from the time-averaged HALOE water vapor
measurements show the ascent of tropical air. Orange indicates
moist air; blue and purple indicate dry air.
(BOTTOM) Air enters the stratosphere through towering tropical
cumulus clouds. During Northern Hemisphere summer, air entering
the tropical stratosphere is slightly wetter (yellow) while during
the Northern Hemisphere winter, air entering the stratosphere
is slightly drier (blue).
[TOP]
|
|
|
Equatorial
Winds
[TOP]
|
|
|
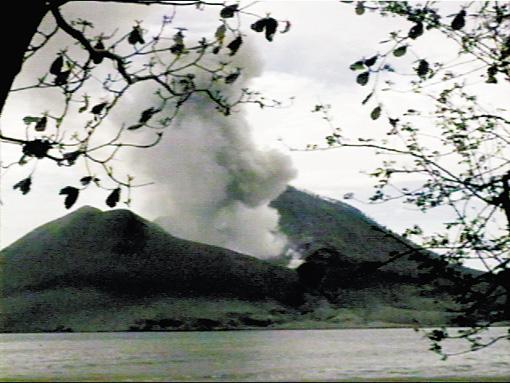
Mt. Pinatubo Erupting
[TOP]
|
|
|
Sulfur Dioxide From Mt. Pinatubo:
Residual SO2 at 26 km measured by MLS
on September 21, 1991, just over 3 months after the eruption
of Mt. Pinatubo.
[TOP]
|
|
|
Global Time
Series of Mt. Pinatubo Aerosol and the Decay of the Mt. Pinatubo
Aerosol Cloud.
[TOP]
|
|
|
SUSIM/ACRIM
[TOP]
|
|
|
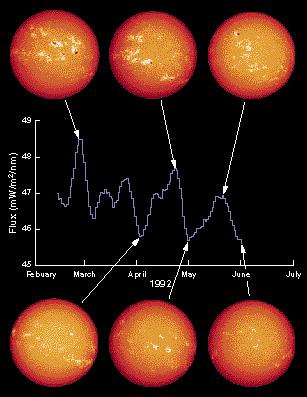
Variations in Solar UV as the Sun Rotates:
A plot of the variation of the UV irradiance during rotation
of the Sun as measured by SOLSTICE. The six solar images correspond
to peaks and valleys of irradiance during the 27-day solar rotation.
The bright regions on the solar images are the source of the
peaks in UV radiation.
[TOP]
|
|
|
PEM
[TOP]
|
|
|
Tidal
Winds
[TOP]
|
|
|
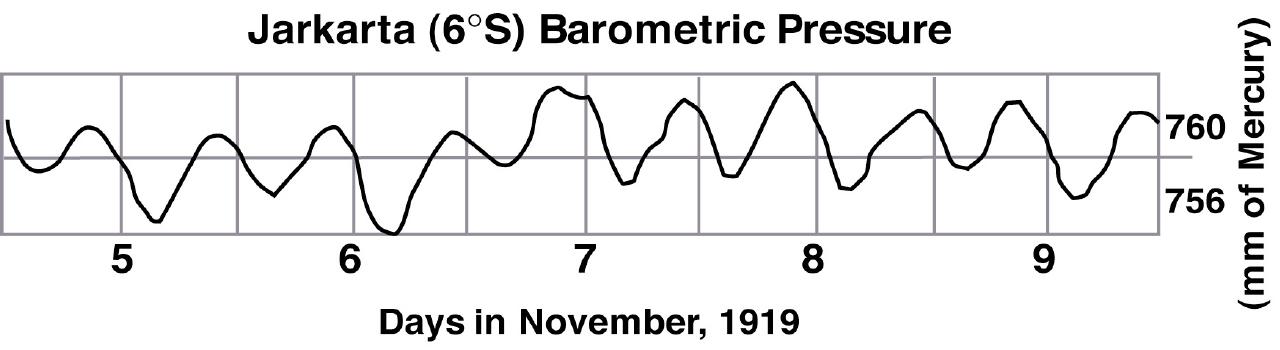
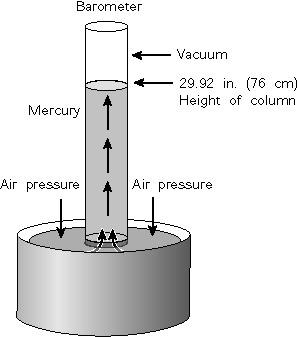
Jakarta Barometric Pressure
[TOP]
|
|
|
Barometer
[TOP]
|
|
|
Tidal Variation
in Airglow
[TOP]
|
|
|
Upper Tropospheric
Water Vapor and El Nino
[TOP]
|
|
|
Gravity
Wave Breaking in the Mesosphere
[TOP]
|
|
|
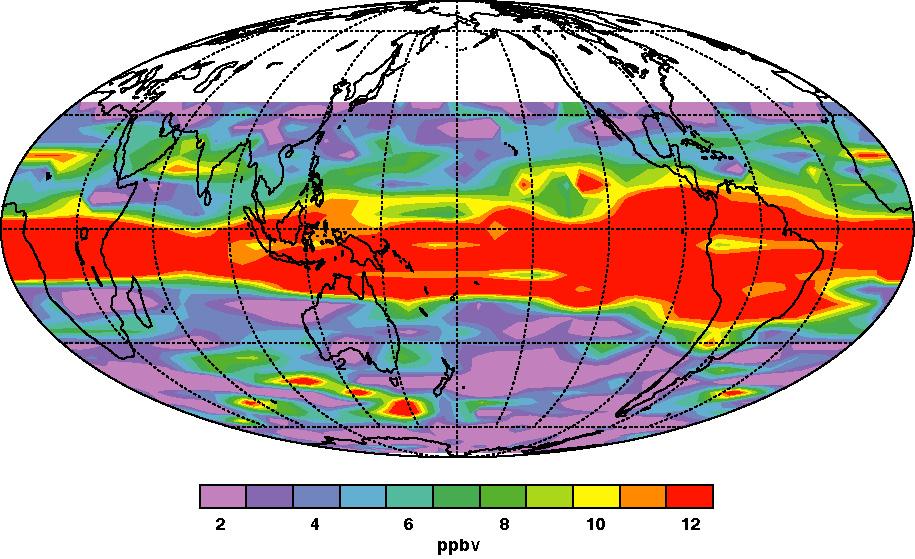
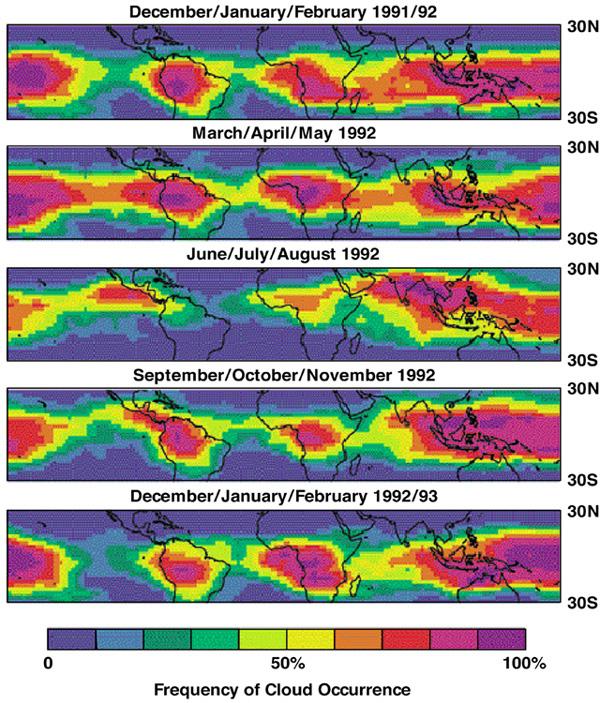
High Clouds in the Tropics:
The occurrence frequency of tropical high thin cirrus clouds
over 3-month periods is shown here. CLAES has been able to map
the location of cirrus clouds better than previous space instruments.
[TOP]
|
|
|
UARS Instrument
Time line
[TOP]
|
|
|
Satellite
Missions
[TOP]
|

