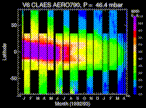
CLAES AER790_46
(aerosol extinction coefficient)
CLAES aerosol extinction coefficient measurement at 46.4 mbar over length of CLAES observing period. |
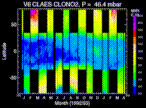
CLAES ClONO2
Measurement of ClONO2 at 46.4 mbar over length of CLAES observing period.
|
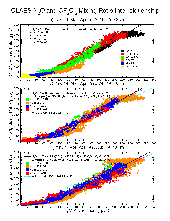
CLAES_CF2CL2_N2O_CORR_DIAG
Correlation scatter diagrams of CLAES CF2Cl2 and N2O zonal-mean
mixing ratios over the altitude range of 19-48 km for various latitudes...
|
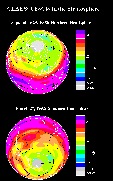
CLAES_CF2CL2_NS2_INVB
The figure shows global polar projections of CLAES stratospheric CF2Cl2
in ppbv
at 21 km (46 mb) in the fall for the northern hemisphere on
September 25, 1992 (top panel) and for the southern hemisphere on March
27, 1992 (lower panel).
The CF2Cl2 variations in latitude and longitude
can be seen in the two panels.
[For more information see "Global CF2Cl2
measurements by UARS cryogenic limb array etalon spectrometer:
Validation by correlative data and a model," by Nightingale et al.,
J.Geophys. Res. 101, 9711-9736, April 30, 1996.]
|
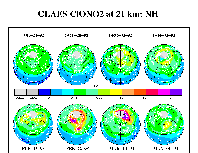
CLAES_CLONO2_N8
Polar orthographic projections of 24 hours of ClONO2 data at 21 km
as measured by CLAES in the Arctic stratosphere for individual days
between July 1992 and May 1993. These days emphasize the northern
winter vortex region and the band or collar of increased ClONO2
around it. [Similar to figures and discussion in "Observations of
Lower-Stratospheric ClONO2, HNO3, and Aerosol by the UARS CLAES
Experiment between January 1992 and April 1993", by Roche et al., J.
Atmos. Sci., 51, 2877-2902, Oct. 15, 1994.]
|
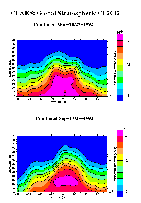
CLAES_CF2CL2_ZM_SN2_PR96
CLAES global stratospheric CF2Cl2 is shown as combined, pole-to-pole
zonal-mean plots in ppbv for two days in March (top panel)
and two days in September 1992 (lower panel).
The two days in each case span the CLAES door closure for the UARS yaw around manuever. The double peaked
structure at higher altitudes in the tropics in March is probably caused
by the semi-annual oscillation (SAO) of the equatorial zonal-mean wind
acting on the long-lived tracer gases in the stratosphere.
[See Plate 1 from "Global CF2Cl2 measurements by UARS cryogenic limb array etalon
spectrometer:
Validation by correlative data and a model," by
Nightingale et al., J. Geophys. Res. 101, 9711-9736, April 30, 1996.]
|