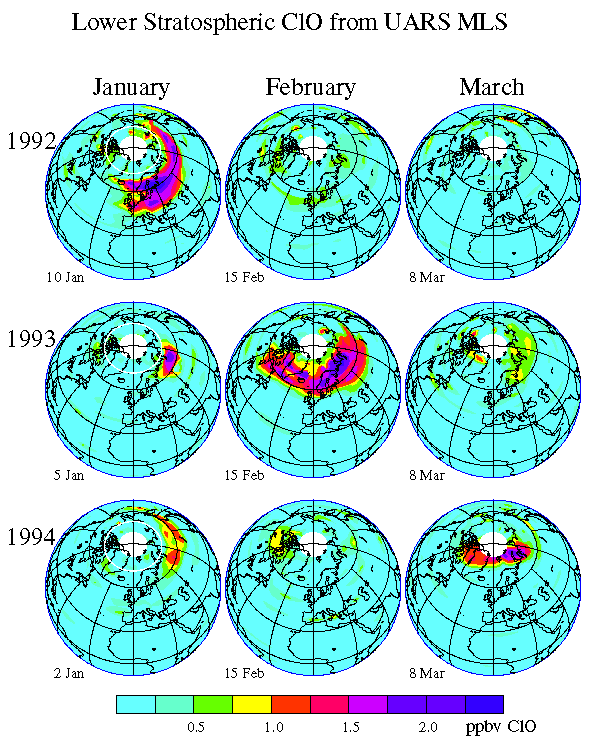
MLS ClO 92,93,94 2-10 Jan,15 Feb,8 Mar
MLS lower stratospheric ClO on Jan. 2-10,
Feb. 15,and Mar. 8 for years 1992, 1993, and 1994 in the Northern Hemisphere.
|
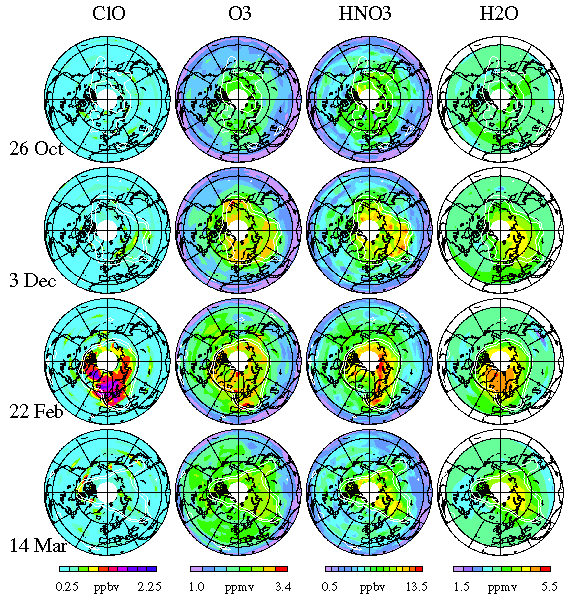
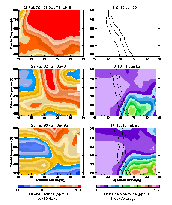
MLS HNO3 O3 H2O CLO North. Hemis.
MLS lower stratospheric HNO3, O3, H2O, and ClO for Oct. 26, 1993, Dec. 3, 1993, Feb. 22, 1994, and Mar. 14, 1994 for the Northern Hemisphere.
|
MLS HNO3 O3 H2O CLO South. Hemis.
MLS lower stratospheric HNO3, O3, H2O, and ClO for Apr. 28, Jun. 2, Aug. 17, and Nov. 1, 1993 for the Southern Hemisphere.
|

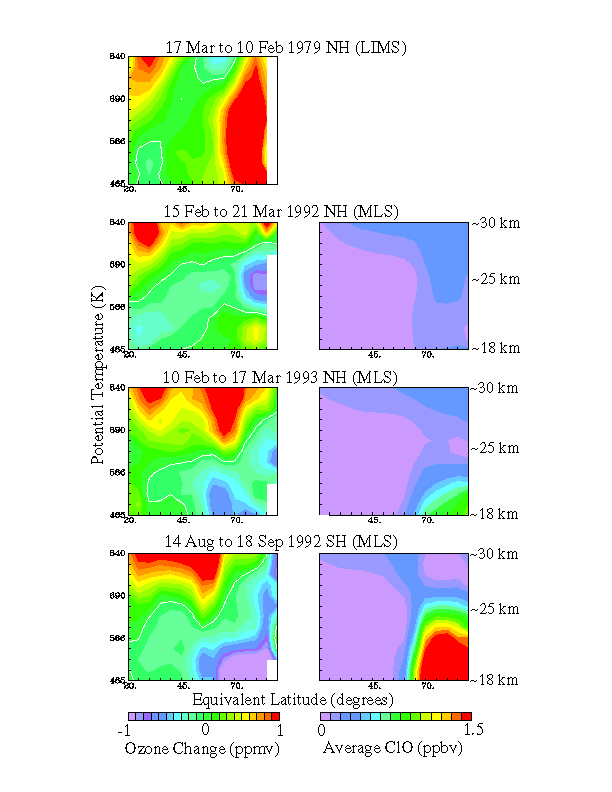
o3_clo_pub
LIMS O3 change from 10 Feb. to 17 Mar., 1979 in the Northern Hemisphere; MLS O3 and ClO change from 15 Feb. to 21 Mar., 1992 in the Northern Hemisphere;MLS O3 and ClO change from 10 Feb. to 17 Mar., 1993 in the Northern Hem
Hemisphere.
|
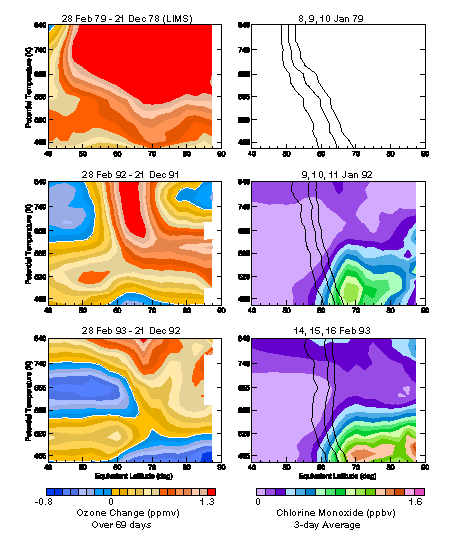
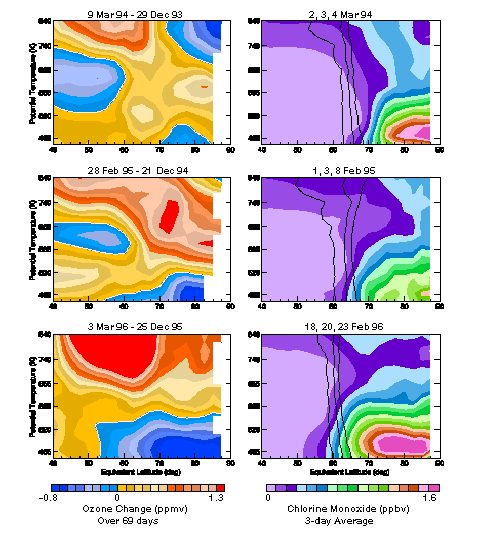
pvtheta_o3diff_clo_pg1
Lower stratospheric ozone differences over 69 days in 1978-79 (LIMS) and 1991-92 through 1995-96 (MLS) in equivalent latitude/theta space and 3-day averages of
MLS ClO for 1991-92 through 1995-96 in equivalent latitude/theta space.
|
pvtheta_o3diff_clo_pg2
Lower stratospheric ozone differences over 69 days in 1978-79 (LIMS) and 1991-92 through 1995-96 (MLS) in equivalent latitude/theta space and 3-day averages of
MLS ClO for 1991-92 through 1995-96 in equivalent latitude/theta space.
|